Outputs
Mean
The ensemble average of all epochs.
Standard Deviation
The standard deviation, calculated using the ensemble average.
Mean + Standard Deviation
The Mean plus one Standard Deviation.
Mean - Standard Deviation
The Mean minus one Standard Deviation.
Captured Data
A waveform displaying which data from the original data was actually used. This allows the user to see which data was thrown out from the threshold operation and the remove outliers operation. Example:
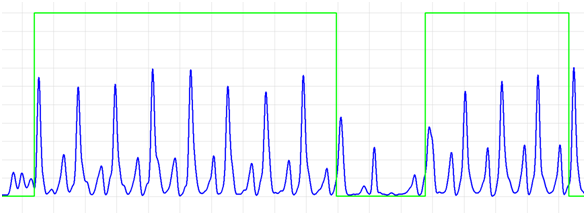
The green waveform is the Captured Data output, in this case, the blue signal is the SDE. The gap shown in the middle of the green waveform is representative of a peak that did not meet the threshold requirements, which resulted in the preceding epoch being too long to pass through the suppression operation.