Analyzing Data: Step 4 - Plotting Results
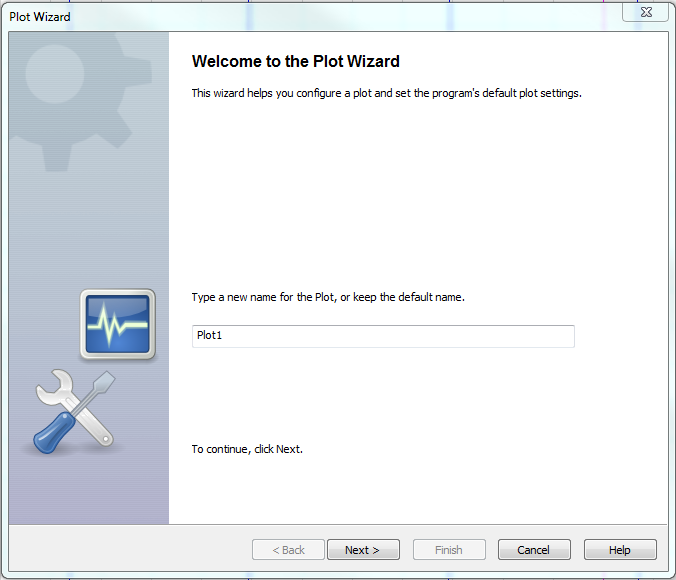
1. Note that each channel produced 5 outputs. We will only plot three from each channel: the mean, and the two series expression the standard deviation error around the mean. From the menu bar, select Plot > Create Plot.
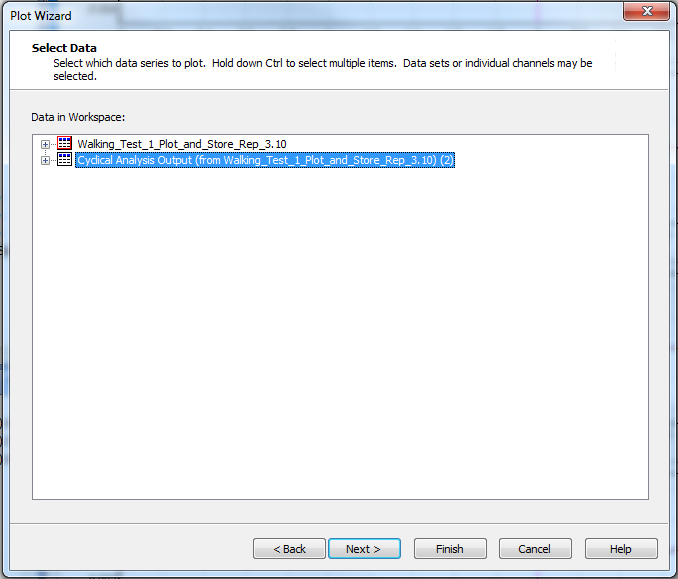
2. Click the Next button. Select all of the output data channels in the Select Data window and click the Next button.
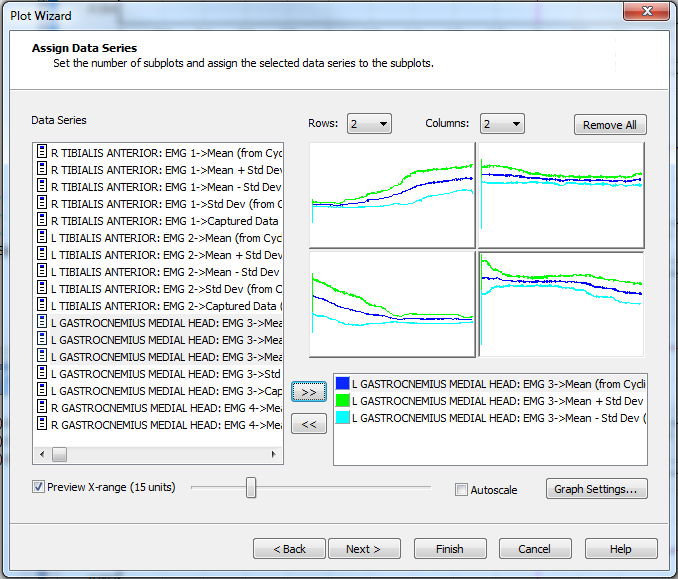
3. In the Assign Data Series window, click the
Remove All button and then assign 2 Rows
and 2 Columns. While the top left plot area
is selected, select the "R TIBIALIS ANTERIOR: EMG 6->Mean", "R TIBIALIS
ANTERIOR: EMG 6->Mean + Std Dev", and the "R TIBIALIS ANTERIOR: EMG
6->Mean - Std Dev" channels and click the ![]() button. Select the
top right plot area. Select the "L TIBIALIS ANTERIOR: EMG 2->Mean", "L
TIBIALIS ANTERIOR: EMG 2->Mean + Std Dev", and the "L TIBIALIS ANTERIOR: EMG
2->Mean - Std Dev" channels and click the
button. Select the
top right plot area. Select the "L TIBIALIS ANTERIOR: EMG 2->Mean", "L
TIBIALIS ANTERIOR: EMG 2->Mean + Std Dev", and the "L TIBIALIS ANTERIOR: EMG
2->Mean - Std Dev" channels and click the ![]() . Select the bottom left
plot area. Select the "R GASTROCNEMIUS LATERAL HEAD: EMG 4->Mean", "R
GASTROCNEMIUS LATERAL HEAD: EMG 4->Mean + Std Dev", and "R GASTROCNEMIUS
LATERAL HEAD: EMG 4->Mean - Std Dev" channels and click the
. Select the bottom left
plot area. Select the "R GASTROCNEMIUS LATERAL HEAD: EMG 4->Mean", "R
GASTROCNEMIUS LATERAL HEAD: EMG 4->Mean + Std Dev", and "R GASTROCNEMIUS
LATERAL HEAD: EMG 4->Mean - Std Dev" channels and click the ![]() button. Select the
bottom right plot area. Select the "L GASTROCNEMIUS LATERAL HEAD: EMG
3->Mean", "L GASTROCNEMIUS LATERAL HEAD: EMG 3->Mean + Std Dev", and "L
GASTROCNEMIUS LATERAL HEAD: EMG 3->Mean - Std Dev" channels and click the
button. Select the
bottom right plot area. Select the "L GASTROCNEMIUS LATERAL HEAD: EMG
3->Mean", "L GASTROCNEMIUS LATERAL HEAD: EMG 3->Mean + Std Dev", and "L
GASTROCNEMIUS LATERAL HEAD: EMG 3->Mean - Std Dev" channels and click the
![]() button. When this is complete, each subplot represents the
mean behavior of a muscle over one gait cycle, and shows the standard deviation
of the signal from this mean in either direction.
button. When this is complete, each subplot represents the
mean behavior of a muscle over one gait cycle, and shows the standard deviation
of the signal from this mean in either direction.
4. Click the Finish button. Unlock the X and Y axis by clicking the X Lock and Y Lock buttons in the plot toolbar. Right click each plot area to autoscale it individually. If the legend obscures the data (as it was here), right click on the plot and select Properties. In the Annotations tab, deselect the Show Legend checkbox, and click OK.
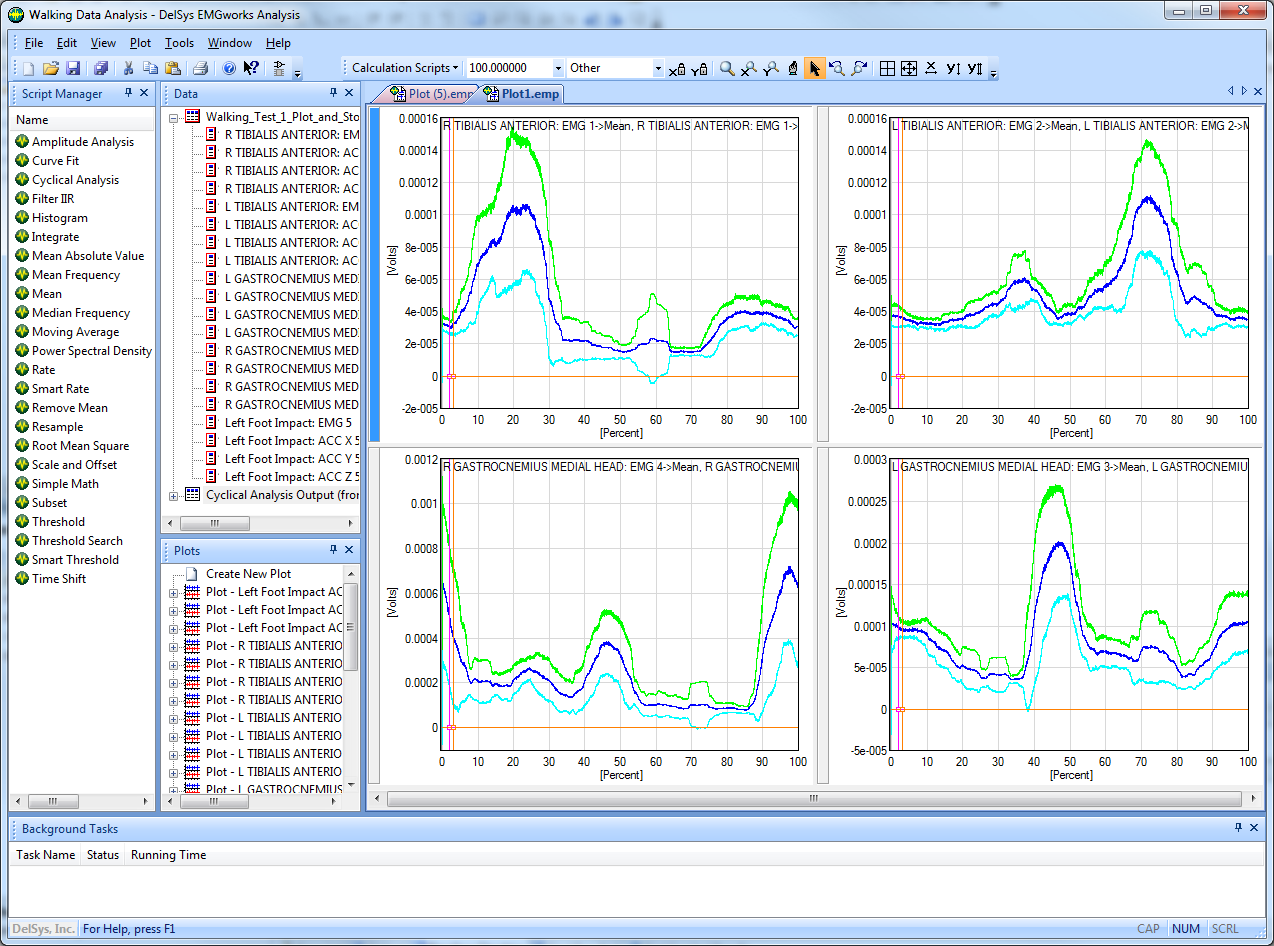
Each of these plots each represents the average signal level a certain percentage of the way through one normalized cycle of the repetitive activity, and indicates the one standard deviation error margin on each channel.