Electromyogram (EMG) signals have proven to be quite effective as tools for researching muscular fatigue. These EMG signals are capable of providing electrical data for an individual muscle, which allows for the use of a spectral fatigue index to describe the performance of individual muscles during activity. In this document, we will present an effective method for analyzing muscular fatigue using two of our EMGworks EMGscripts, known as the Median Frequency and Curve Fit scripts.
The Median Frequency is the frequency at which the EMG power spectrum is divided into two regions with equal amounts of power. Analysis of the Median Frequency has been regarded as one of the most effective methods for processing EMG signals during fatigue analysis. This is because muscle fatigue results in an aesthetically pleasing downward shift of the EMG frequency spectrum as time increases.
The Curve Fit EMGscript is capable of determining a Logarithmic, Polynomial, or Exponential calculation that fits the data series. For Fatigue Analysis, we will want to use a second order Polynomial curve, as it will be an ideal fit for the Median Frequency spectrum’s anticipated decay pattern.
For more information regarding our EMGscript calculations, please view further details in the Calculations tab of our online User’s Guide here.
How to Use EMGscripts for Fatigue Analysis
- Add an .hpf, .emg, or text file to the EMGworks Analysis Workspace.
- Right click on the raw EMG data channel in your Workspace and plot the data by selecting Plot as Subplots.
- Right click on the raw EMG data channel in your Workspace → go to “Calculation Scripts” → click on “Median Frequency.”
- Enter the desired parameters. Note: It is recommended that the default settings be used for your analysis; however, the user is free to set the parameters as he or she sees fit.The user can view information regarding the Median Frequency EMGscript’s parameters in the User’s Guide by following this link → Calculations → Median Frequency → Parameters.
- Click “OK” when the parameters have been set. A new data sequence titled “Median Frequency Output” will appear in the Workspace.
- Right click on the data file under “Median Frequency Output” → go to “Calculation Scripts” → click on “Curve Fit.”
- Enter the desired parameters.The user can view information regarding the Curve Fit EMGscript’s parameters in the User’s Guide by following this link → Calculations → Curve Fit → Parameters.
- Click “OK” when the parameters have been set. A new data sequence titled “Curve Fit Output” will appear in the Workspace.
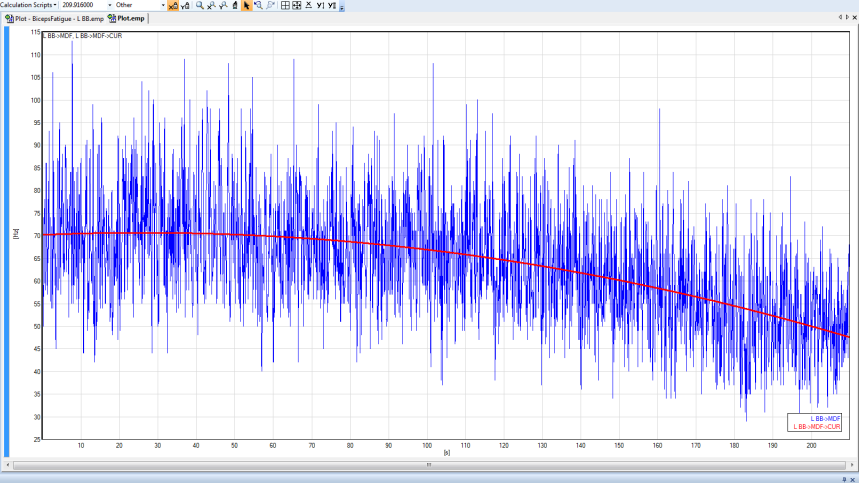
- Highlight both Median Frequency and Curve Fit outputs, then right click to choose Plot Overlaid.
- Blue trace: time-varying median frequency of the original EMG signal.
- Red trace: second order curve fit showing the decrease in median frequency over time, a phenomenon commonly observed during muscle fatigue.