Step 3 - Plotting the Data
Before performing any analysis, the raw data will be plotted.
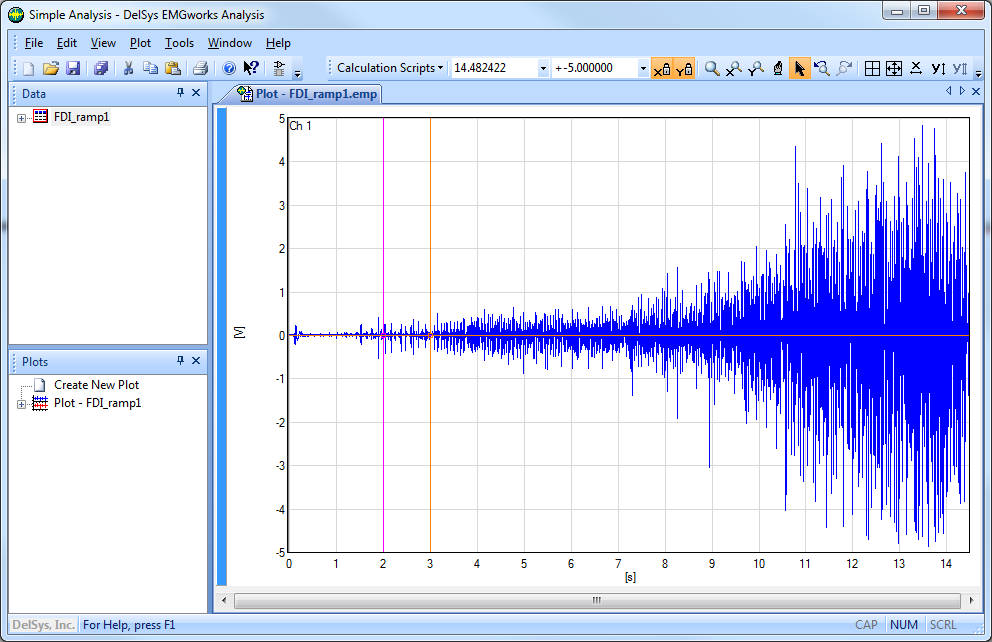
1. Right click on the "FDI_ramp1" Data File in the Workspace and choose Plot as Subplots. This will plot the Data File using the default Plot Properties with 1 channel on each subplot. Subplots divide a single plot documents into individual plots which can have independent data and settings. Maximize the Plot and choose Plot > Autoscale from the Main Menu to autoscale the plot in the x and y axes.