Analyzing Data: Step 3 - Plotting Results
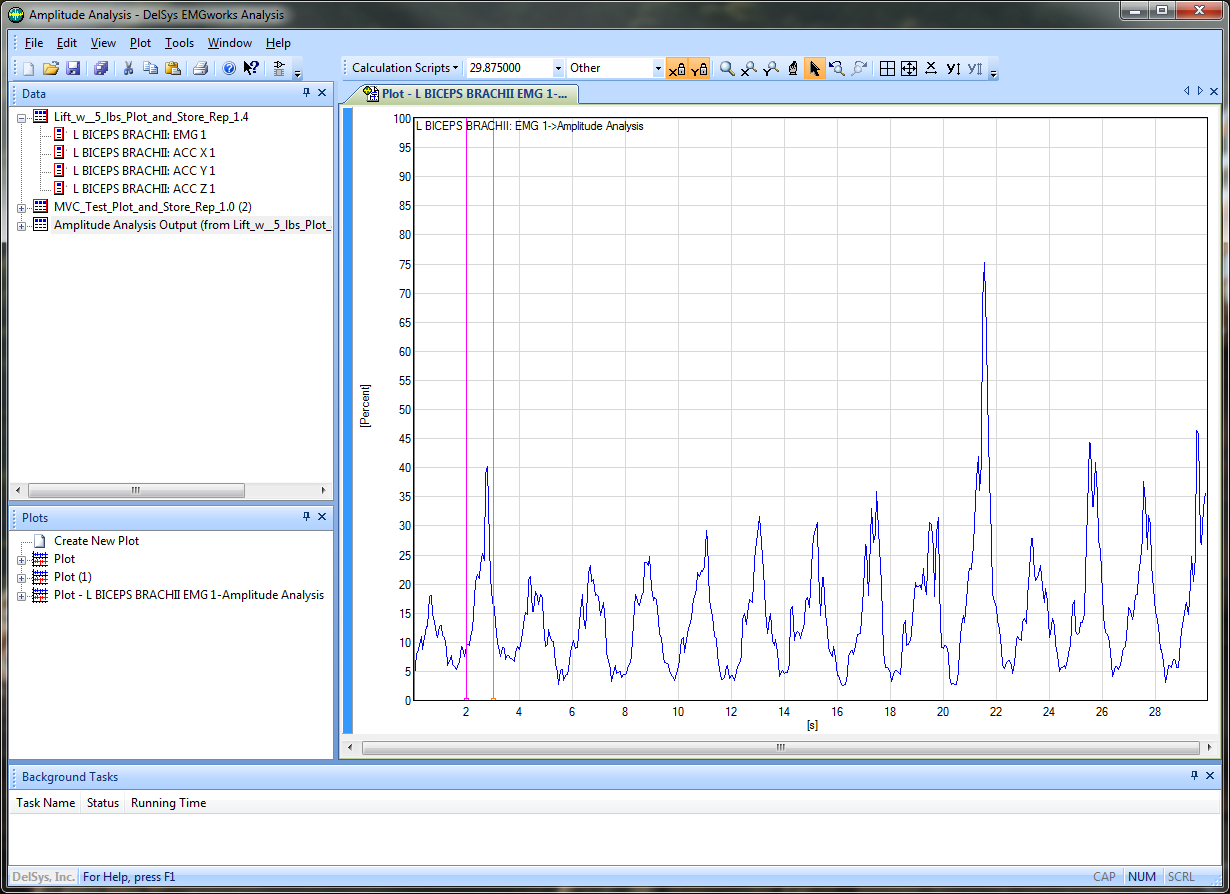
1. Right click on the output from the calculation and select Plot Separately. Right click in the subsequent plot area and select Auto Scale. The plot shows the signal as a percentage of the MVC signal.

1. Right click on the output from the calculation and select Plot Separately. Right click in the subsequent plot area and select Auto Scale. The plot shows the signal as a percentage of the MVC signal.
