Advanced Step 7 - Plotting the Results
1. The data has now been added to the workspace. Now we will create a plot that displays each channel of EMG data overlaid with the processed data. From the top menu bar select Plots > Create Plot.
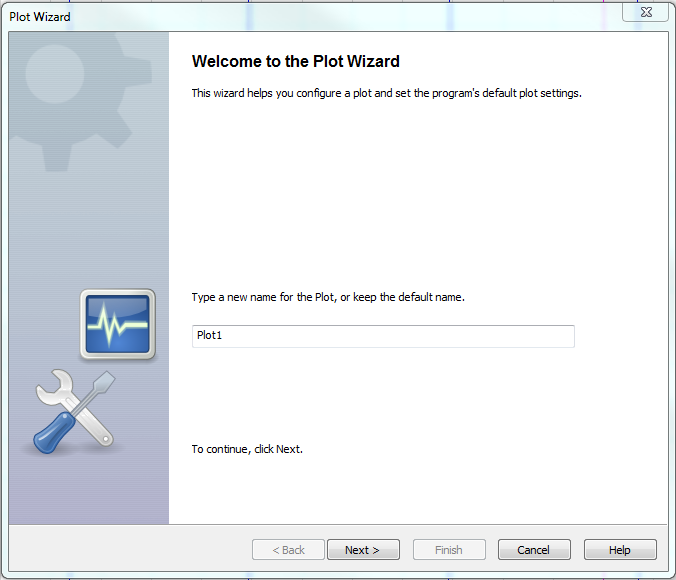
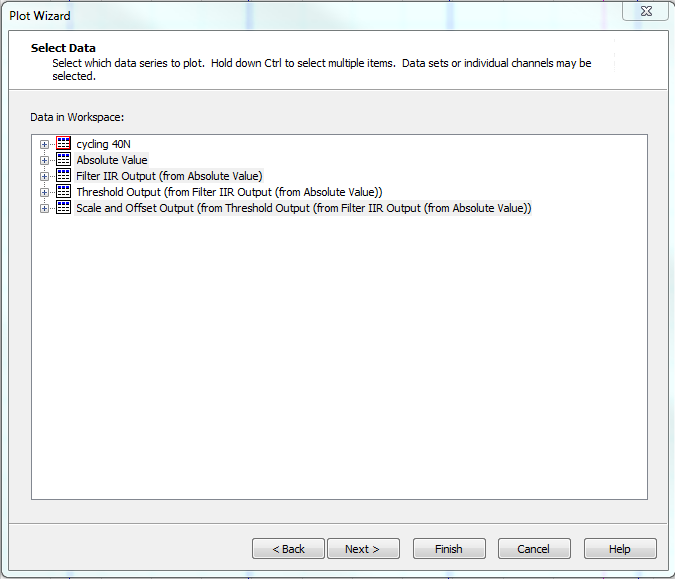
2. Click the Next button, or rename your plot and then click the Next button. In the following window titled "Select Data", hold down the ctrl button to select multiple series and select "Absolute Value", "Filter IIR...", and "Scale and Offsett...". Click the Next button.
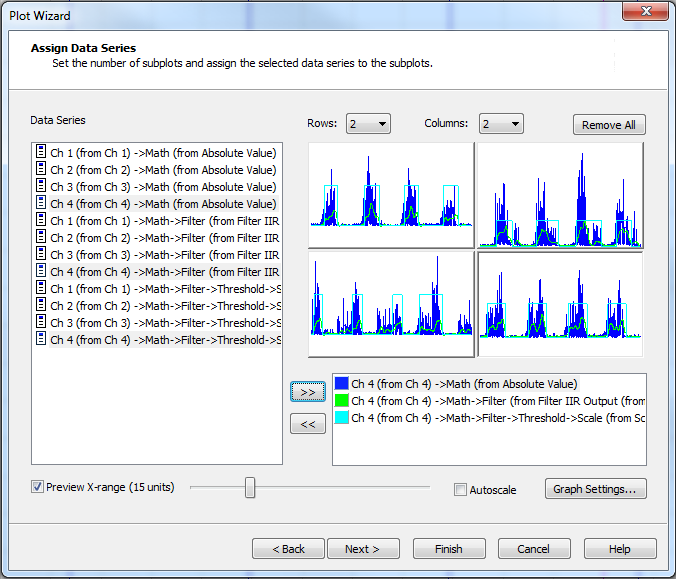
3. In the following window titled "Assign Data
Series" first click the Remove All button, then select to plot
2 Rows and 2 Columns. Click on the top left plot window and then ctrl
click all of the "Ch 1" Data Series and click the  button. This moves these data series to the
selected plot. Now click on the top right plot area and use ctrl to select
all the "Ch 2" Data Series and click the button. Repeat this to move the "Ch 3"
Data Series' to the bottom left plot area, and the "Ch 4" Data Series' to the
bottom right plot area.
button. This moves these data series to the
selected plot. Now click on the top right plot area and use ctrl to select
all the "Ch 2" Data Series and click the button. Repeat this to move the "Ch 3"
Data Series' to the bottom left plot area, and the "Ch 4" Data Series' to the
bottom right plot area.
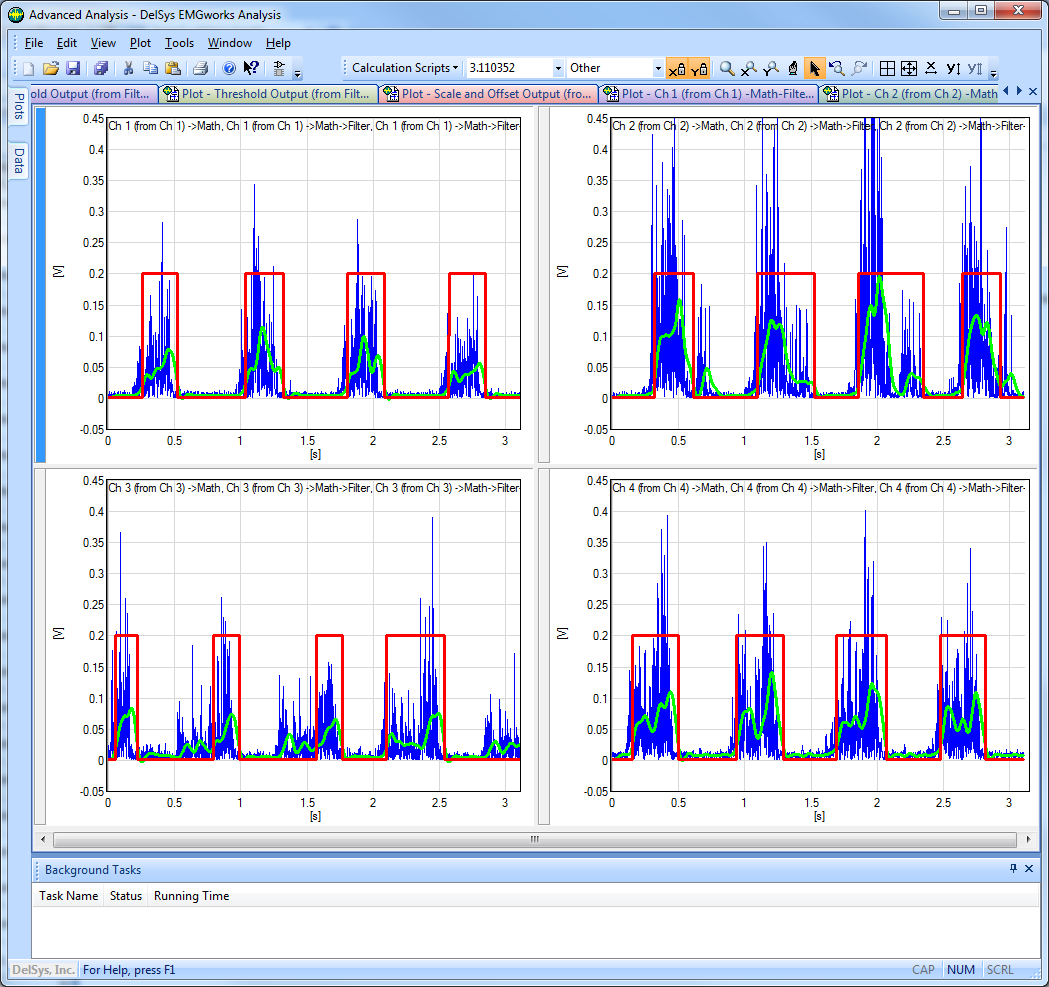
4. Click the Finish button. The plots will appear in the plot window. Right-click the plot area and select Auto Scale to rescale the data appropriately. Note that the threshold results and the filtered data are difficult to see with the original data also in the plot. As well, the legend is big and blocks a significant portion of the data. Right click on the plot and select Properties.
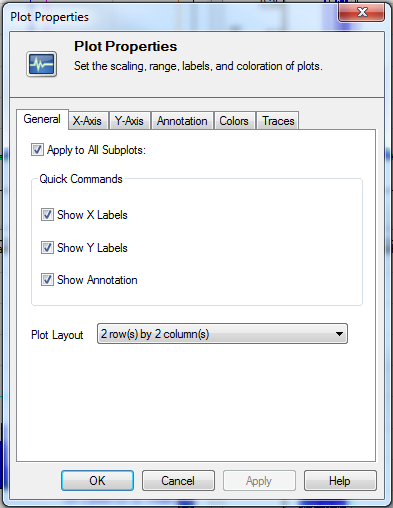
5. The Plot Properties window tabs allow you to adjust all the of the settings for the plot (scaling, range, labels, color, etc.). In the General tab check the box labeled Apply to All Subplots so that all the changes made will propagate to all subplots in this plot.
6. Click the Traces tab. From the drop down menu titled "Trace" select the trace to modify. In this case select "Ch 1 (from Ch 1)->Math->Filter (overlaid)". Adjust the Weight to 3. Select trace "Ch 1 (from Ch 1)->Math->Filter->Threshold->Scale (overlaid)". Adjust the color to red by clicking the Change Color button and selecting red. Adjust the Weight to 3. If desired, repeat these settings for the remaining data series in the subplots.
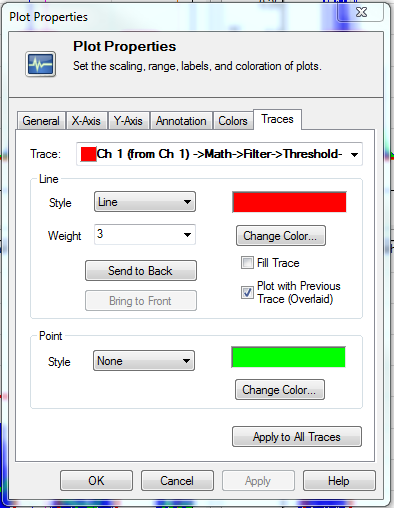
7. Click the Apply button to preview the selection in the plots without leaving the Properties dialog box. If the settings are satisfactory, click OK.
8. Click the ![]() Save All button in the Toolbar to save the
Workspace and the Plots that were created in this
tutorial.
Save All button in the Toolbar to save the
Workspace and the Plots that were created in this
tutorial.